Postingan

Menampilkan postingan dari September, 2019

Secularization in America, part one.

Gambar
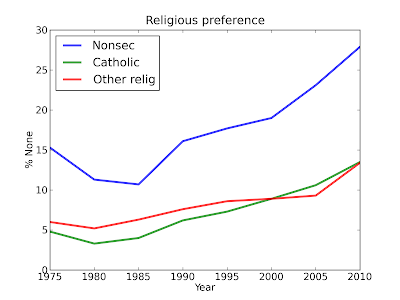
In the last year or so I have written several articles about trends in religion among college students: Are religious colleges getting more religious? Freshman hordes more godless than ever! Freshman hordes even more godless! All of these are based on data from  the  Cooperative Institutional Research Program (CIRP)  which runs  the Freshman Survey, an annual survey of more than 200,000 incoming students at 270 colleges and universities in the U.S. More recently, I read Secularization: In Defence of an Unfashionable Theory, by Steve Bruce.  Bruce presents the "unfashionable theory" that as societies modernize, they secularize.  In his formulation, modernization includes trends toward individualism, industrial capitalism, science and technology; and secularization means "decline in the social significance of religion." The poster child for secularization is Western Europe, where the social influence of religion has been in decline for centuri...
Secularization in America: part two

Gambar
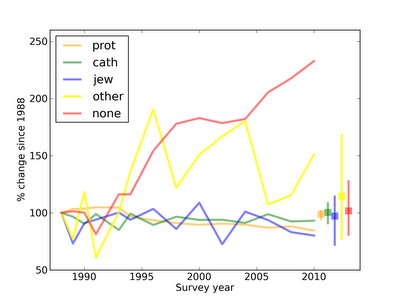
In Part One I described some trends in market share of the major religions in the U.S.; in particular, since 1988, the fraction of Protestants dropped from 60% to 51%, and  the fraction of people with no religious affiliation increased from 8% to 18%. I would like to know if something happened after 1988 to cause these changes, or if they could have been predicted based on patterns occurring before 1988.  As a first step, I will use data from 1988 to model vertical transmission (from parent to child) and see if it predicts the observed changes My model of vertical transmission works like this: Each respondent chooses a spouse, Each pair decides what religion to bring their children up in, Each child chooses a religion. I model each step of this process using data from  the General Social Survey (GSS); specifically, I used these variables. RELIG: What is your religous preference? RELIG16: In what religion were you raised? MARELIG:  What was your mothe...

Secularization in America: part three

Gambar
In   Part One   I described trends in market share of major religions in the U.S.: since 1988, the fraction of Protestants dropped from 60% to 51%, and  the fraction of people with no religious affiliation increased from 8% to 18%. In Part Two I used data from the 1988 General Social Survey (GSS) to model transmission of religion from parent to child, and found that the model failed to predict the decrease in Protestants and the increase in Nones that occurred between 1988 and 2010. I proposed several reasons the model might have failed: The spouse tables are based on the parents of 1988 respondents.  People from later generations might be increasingly likely to marry outside their religion. The environment table is also based on the previous generation; again, later parents might be making different decisions about the religious environment of their children. The transmission table is based on 1988 respondents; it's possible that after 1988, children were l...

Secularization in America: part four

Gambar
Summary so far In   Part One   I described trends in market share of major religions in the U.S.: since 1988, the fraction of Protestants dropped from 60% to 51%, and  the fraction of people with no religious affiliation increased from 8% to 18%. In Part Two I used data from the 1988 General Social Survey (GSS) to model transmission of religion from parent to child, and found that the model failed to predict the decrease in Protestants and the increase in Nones that occurred between 1988 and 2010. In Part Three I looked at changes, between 1988 and 2008, in the spouse tables (which describe the tendencies of people to marry within their religions), the environment table (which describes parents' decisions about their children's religious upbringing), and the transmission table (which describes the likely outcomes for children raised within each religion).  I found that the transmission table has changed substantially since 1988, and accounts for a la...

Are religious colleges getting more religious?

Gambar
In response to my article about the increasing numbers of students entering college with no religious affiliation, a reader wrote: A potentially interesting trend to look at is the religious participation of students attending Catholic or other religious institutions. I wonder if the trend is toward religious students (those who report both religious affiliation and participation in students) being more likely to go to religiously-affiliated colleges. This would mean a reduction of religious students at state/non-sectarian schools and an increase in the religiosity of students at affiliated schools (this might even be skewed because the survey doesn't include some of the most religious schools such as Liberty University). This would be a reflection of the increasing polarization of our society.    On another subject, I tend to distrust steadily increasing social trends. From a complexity theory perspective, I would expect more of a cycle in religious (dis-)belief, so I wou...

Fog warning system: part three

Gambar
Background :  I am trying to evaluate the effect on traffic safety of a fog warning system deployed in California in November 1996.  The system was installed by CalTrans on a section of I-5 and SR-120 near Stockton where the accident rate is generally high, particularly during the morning commute when ground fog is common.   The warning system consists of (1) weather monitoring stations that detect fog and (2) changeable message signs that warn drivers to reduce speed. I will post my findings as I go in order to solicit comments from professionals and demonstrate methods for students.  If I can get permission, I will also post my data and code so you can follow along at home. Previously : In the first installment I reviewed the first batch of data I am working with, and ran some tests to confirm that Poisson regression is appropriate for modeling the number of accidents in a given day.  In part two I ran Poisson regressions to identify factor...